
The IES are now signatories to the Pledge to Net Zero initiative. Our team have been hard at work collecting data needed to calculate our current greenhouse gas (GHG) emissions. These data cover as many aspects of our operations as we can accurately determine across all three scopes as defined by the GHG Protocol.
-
“Scope 1: Direct GHG emissions occurring from sources that are owned or controlled by the company, for example, emissions from combustion in owned or controlled boilers, furnaces, vehicles, etc.; emissions from chemical production in owned or controlled process equipment.”
-
“Scope 2: Indirect greenhouse gas emissions from consumption of purchased electricity, heat or steam.”
-
“Scope 3: Other indirect emissions, such as the extraction and production of purchased materials and fuels, transport-related activities in vehicles not owned or controlled by the reporting entity, electricity-related activities (e.g. transportation and distribution losses) not covered in Scope 2, outsourced activities, waste disposal, etc.”
We have set our baseline year to fall between April 2019 and March 2020. We chose this period as it is the most recent time frame that affords us a full set of reliable data for as many categories as possible within our organisational and operational boundaries. As a small team of 7 full-time staff and 2 part-time staff, our organisational boundary is relatively limited. We do not own or control any processing or producing operations or facilities. We recycle as much as we can including our food, plastics and metals, ink cartridges and batteries, and we purchase second-hand and recycled goods over new products for office supplies and furniture. We operate out of one main office, which uses a 100% renewable energy tariff and has no gas in the property, with electric central heating. We do not have any company-owned vehicles and encourage our staff, council and volunteers to use public transport where possible for business travel. Several of our staff choose to commute to work by bike and none do so by private vehicle. We are also very conscious of single-use plastics!
Whilst not an exhaustive list, the diagram below is indicative of the categories that the IES is accountable for within our organisational boundary.
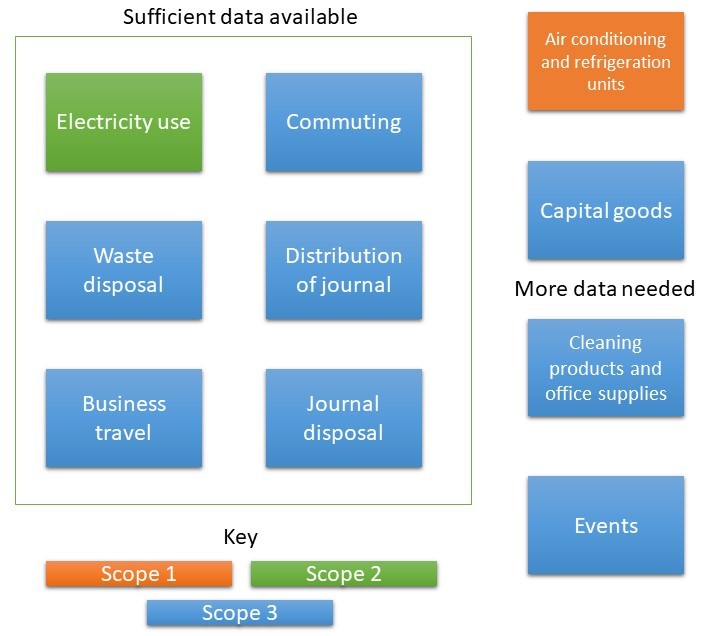
Of those within boundary, we have sufficient data to calculate an estimation of our current emissions and set targets for 6 categories. As part of this process and the ongoing reporting, we will endeavour to improve our data collection processes for these, and for the remaining 4 categories within our organisational and operational boundaries that we currently do not have sufficient data for. At the time of writing, we do not have sufficient data on our air conditioning units and refrigerator unit within the office; we are producing Scope 1 GHG emissions but we cannot calculate these accurately at this stage. Upon return to the office, we will begin collecting these data, which will allow us to rebase our targets for Scope 1. As we are running our operations using a 100% renewable energy tariff, we do not produce GHG emissions under Scope 2, which includes our heating system (electric central heating), as there is no gas or fuel consumption in the property. Given the available data, we have calculated our current emissions of Scope 3, as well as our target emissions based on a well below 2°C climate change scenario, which aims for a 2.5% reduction each recording year. We have also determined a location-based vs market-based approach of emissions under Scope 2.
| 2019 GHG emissions (tCO2e) | 2025 GHG emissions (tCO2e) | GHG reduction | |
|
Scope 1 |
0 | 0 | 0% |
|
Scope 2 (location-based) |
0 (1.58) |
0 (1.34) |
0% (15%) |
| Scope 3 | 7.13 | 6.06 | 15% |
Business travel was calculated at 6.19 tCO2e across the base year and is our biggest source of GHG emissions. This is likely to be an underestimation as exact distances were not recorded; distances were calculated retrospectively using recorded addresses. For interest, we also calculated what our Scope 2 emissions would be if we were taking electricity directly from the grid; this calculated to be 1.58 tCO2e across the base year. By ensuring we operate with a 100% renewable tariff, we have already reduced our potential GHG emissions by this amount.
These data have been verified by the UNFCCC Climate Neutral Now campaign, detailing our business travel, staff commuting, business meals and office energy consumption. A report can be found here; please note our calculations have tended to overestimate our GHG emissions, particularly with journal distribution, when compared with this report. For a full account of how these data are split into different categories within each scope, please send a request to the Programme Lead.
Moving forward, we aim to improve our accuracy on the 4 remaining categories that we currently do not have sufficient data for, such as collecting venue energy consumption and travel data from event attendees. We will also be looking at ways we can reduce our Scope 3 emissions in line with our 15% reduction target such as online events and virtual event attendance, digitising some of our operations such as welcome packs and looking to create an opt-in postal service for our journal. A full report of our emissions and progress towards our targets will be available towards the end of the year, in line with our pledge.
To do your part, why not open the discussions with your organisation around pledging to net zero?