

Listen to more episodes of 'From the Archive' on the series hub.
Almost every week, more and more evidence emerges of the health effects of air pollution. In an effort to tackle this, cities across Europe are discussing “Clean Air Zones” (CAZs), with a primary focus on Nitrogen Dioxide (NO2) concentrations. A potential consequence, not readily communicated to the public, is that the bigger and marginally more fuel-efficient new vehicles have made little improvement in Carbon Dioxide (CO2) emissions. In the case of switching from Diesel to Petrol, or from a small car to an SUV, the fuel efficiency of the fleet could decrease, resulting in an increase in CO2 emissions in our urban areas.
CO2 in the atmosphere is generally associated with Climate Change but the gas also plays a central role in the human body. Breathing is generally associated with inhaling Oxygen (O2), used in the metabolisation of sugars and fatty acids in our cells to produce energy. In consuming this O2 the body generates CO2; it is just as important this CO2 is exhaled as fresh O2 is inhaled. In fact, the trigger for breathing is CO2. The two main ‘detectors’ in the body are Peripheral Chemoreceptors (PC) in the blood vessels and Central Chemoreceptors (CC) in the Brain. While the PC focus on Oxygen, the CC monitor blood PH, which is altered by CO2 levels. It is the CC that have the primary control over breathing rate1. It is also these elevated CO2 levels in the blood that trigger the suffocation feeling when you hold your breath. For example, someone walking into a room of pure Nitrogen and breathing normally would not be gasping for breath, as the body would still be able to expel CO2, but in a few seconds would pass out.
CO2 only makes up a tiny proportion of the air we breathe: 0.04 per cent, compared with 20 per cent Oxygen. In a confined space, we barely notice the decrease in O2 levels, but the increase in CO2 is very significant. Ask any building service engineer about indoor air quality and ventilation systems and CO2 will likely crop up in the discussion. In poorly ventilated indoor spaces, the more humans that are breathing, the quicker the CO2 concentrations will rise. An office or lecture theatre without mechanical ventilation and closed windows will easily see CO2 concentrations well above 1000 ppm, the generally accepted upper threshold for a well-ventilated space. In a packed lecture theatre they could easily hit 5,000 ppm.
Life-threatening levels of CO2 aren’t reached until around 40,000 ppm2. The Health and Safety Executive (HSE) mandates 15,000 ppm as the 15 minute (short term) and 5,000 ppm as the 8 hour (full working day) limit. But well before these limits are reached, increased CO2 can cause cognitive function and concentration levels to be impaired. CO2 levels as low as 600 ppm have been shown to noticeably affect people’s abilities to carry out tasks3. As concentrations rise above 1,000 ppm, decision-making ability can be impeded by a further 23 per cent3. The lecture theatre with 5,000 ppm would leave delegates or students lethargic and struggling to concentrate.
NASA has extensively researched extended exposure to elevated CO2 concentrations in confined spaces for space travel4,5 and extended periods on submarines6. As well as cognitive function impairment, elevated CO2 concentrations cause blood PH to drop (become more acidic), triggering compensation measures in the body, such as the widening of the blood vessels and alterations to kidney function, in particular, the release of bicarbonate into the bloodstream. Chronic long term exposure to elevated CO2 leads to desensitisation of the receptors, decreasing feedback mechanisms in the body. For instance, the kidneys stop releasing bicarbonate into the blood and instead Calcium from the bones is used to regulate blood PH. Over time this can cause bones to breakdown as calcium is metabolised by the kidneys to compensate for increased blood acidity. Globally incidences of nephrolithiasis or kidney stones are on the rise. The reasons for this are not fully understood, it is likely due to changes in diet, however, climate change has been cited as a possible culprit7.
It might seem logical to think that if high CO2 levels in a room cause drowsiness it would be conducive to a good night’s sleep, but elevated concentrations in poorly ventilated bedrooms can reduce sleep quality and have been associated with higher mortality rates in people with sleep breathing disorders8. In terms of the spaces we occupy on a day-to-day basis, some of the highest CO2 levels are seen in vehicles, with concentrations in a car during a 2-hour journey measured to be as high as 5,000 ppm and the inside of motorbike helmets found to consistently exceed 10,000 ppm and sometimes reach as high as 20,000 ppm9.
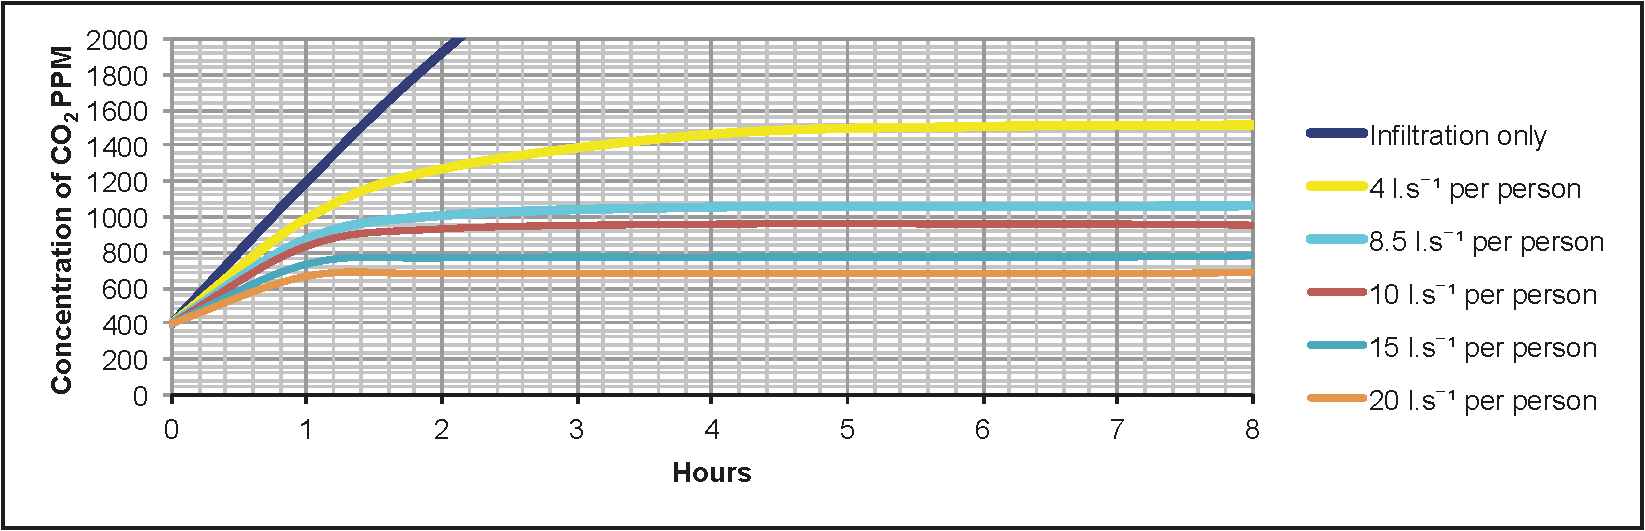
| Figure 1: Average room CO2 levels at various fresh air supply rates for example office with 20 people.10 |
Figure 1 shows the air change rates required to maintain a given CO2 concentration in a typical office with 20 people breathing normally. To push concentrations below 700 ppm requires more than double the air volume that maintaining below 1000 ppm, with significant system size, cost and energy (CO2 emission) increases. Higher ambient (outdoor) CO2 levels push these values even higher. As a rule of thumb, for every 50 ppm increase in outdoor concentrations, a 10 per cent increase in airflow volume is required to maintain indoor concentrations below 1000 ppm11. Building Service Engineers model performance of buildings using base and future year weather files to estimate, amongst other things, thermal performance and ventilation sizing. One of the most widely used and respected are those provided by the Chartered Institute of Building Service Engineers (CIBSE)12. Whilst they include ambient temperature estimates for future years they don’t consider that by 2050 outdoor CO2 concentrations could be as high as 650 ppm (Figure 2) potentially leaving systems undersized by over 50 per cent.
CO2 and Climate Change, a recap
Before the industrial revolution kicked off around 1760, global average CO2 was a fresh 278 ppm. In April 2014 this crept above 400 ppm, reaching a 400,000 year high for planet earth. The average for July 2019 was 411.77 ppm, 4.06 ppm higher than the same month in 201813. CO2 is one of a number of “Well Mixed Green House Gases” (WMGHG) that contribute to the radiative forcing causing climate change. The “well mixed” means just that, global average variation is a mere 40 ppm, the analysis of which has recently become easier thanks to the OCO-2 satellite launched by NASA in 201414. It may seem logical to think combustion fumes float away above us, but the composition of gases in our atmosphere is relatively uniform from the ground up to approximately 8 km15.
|
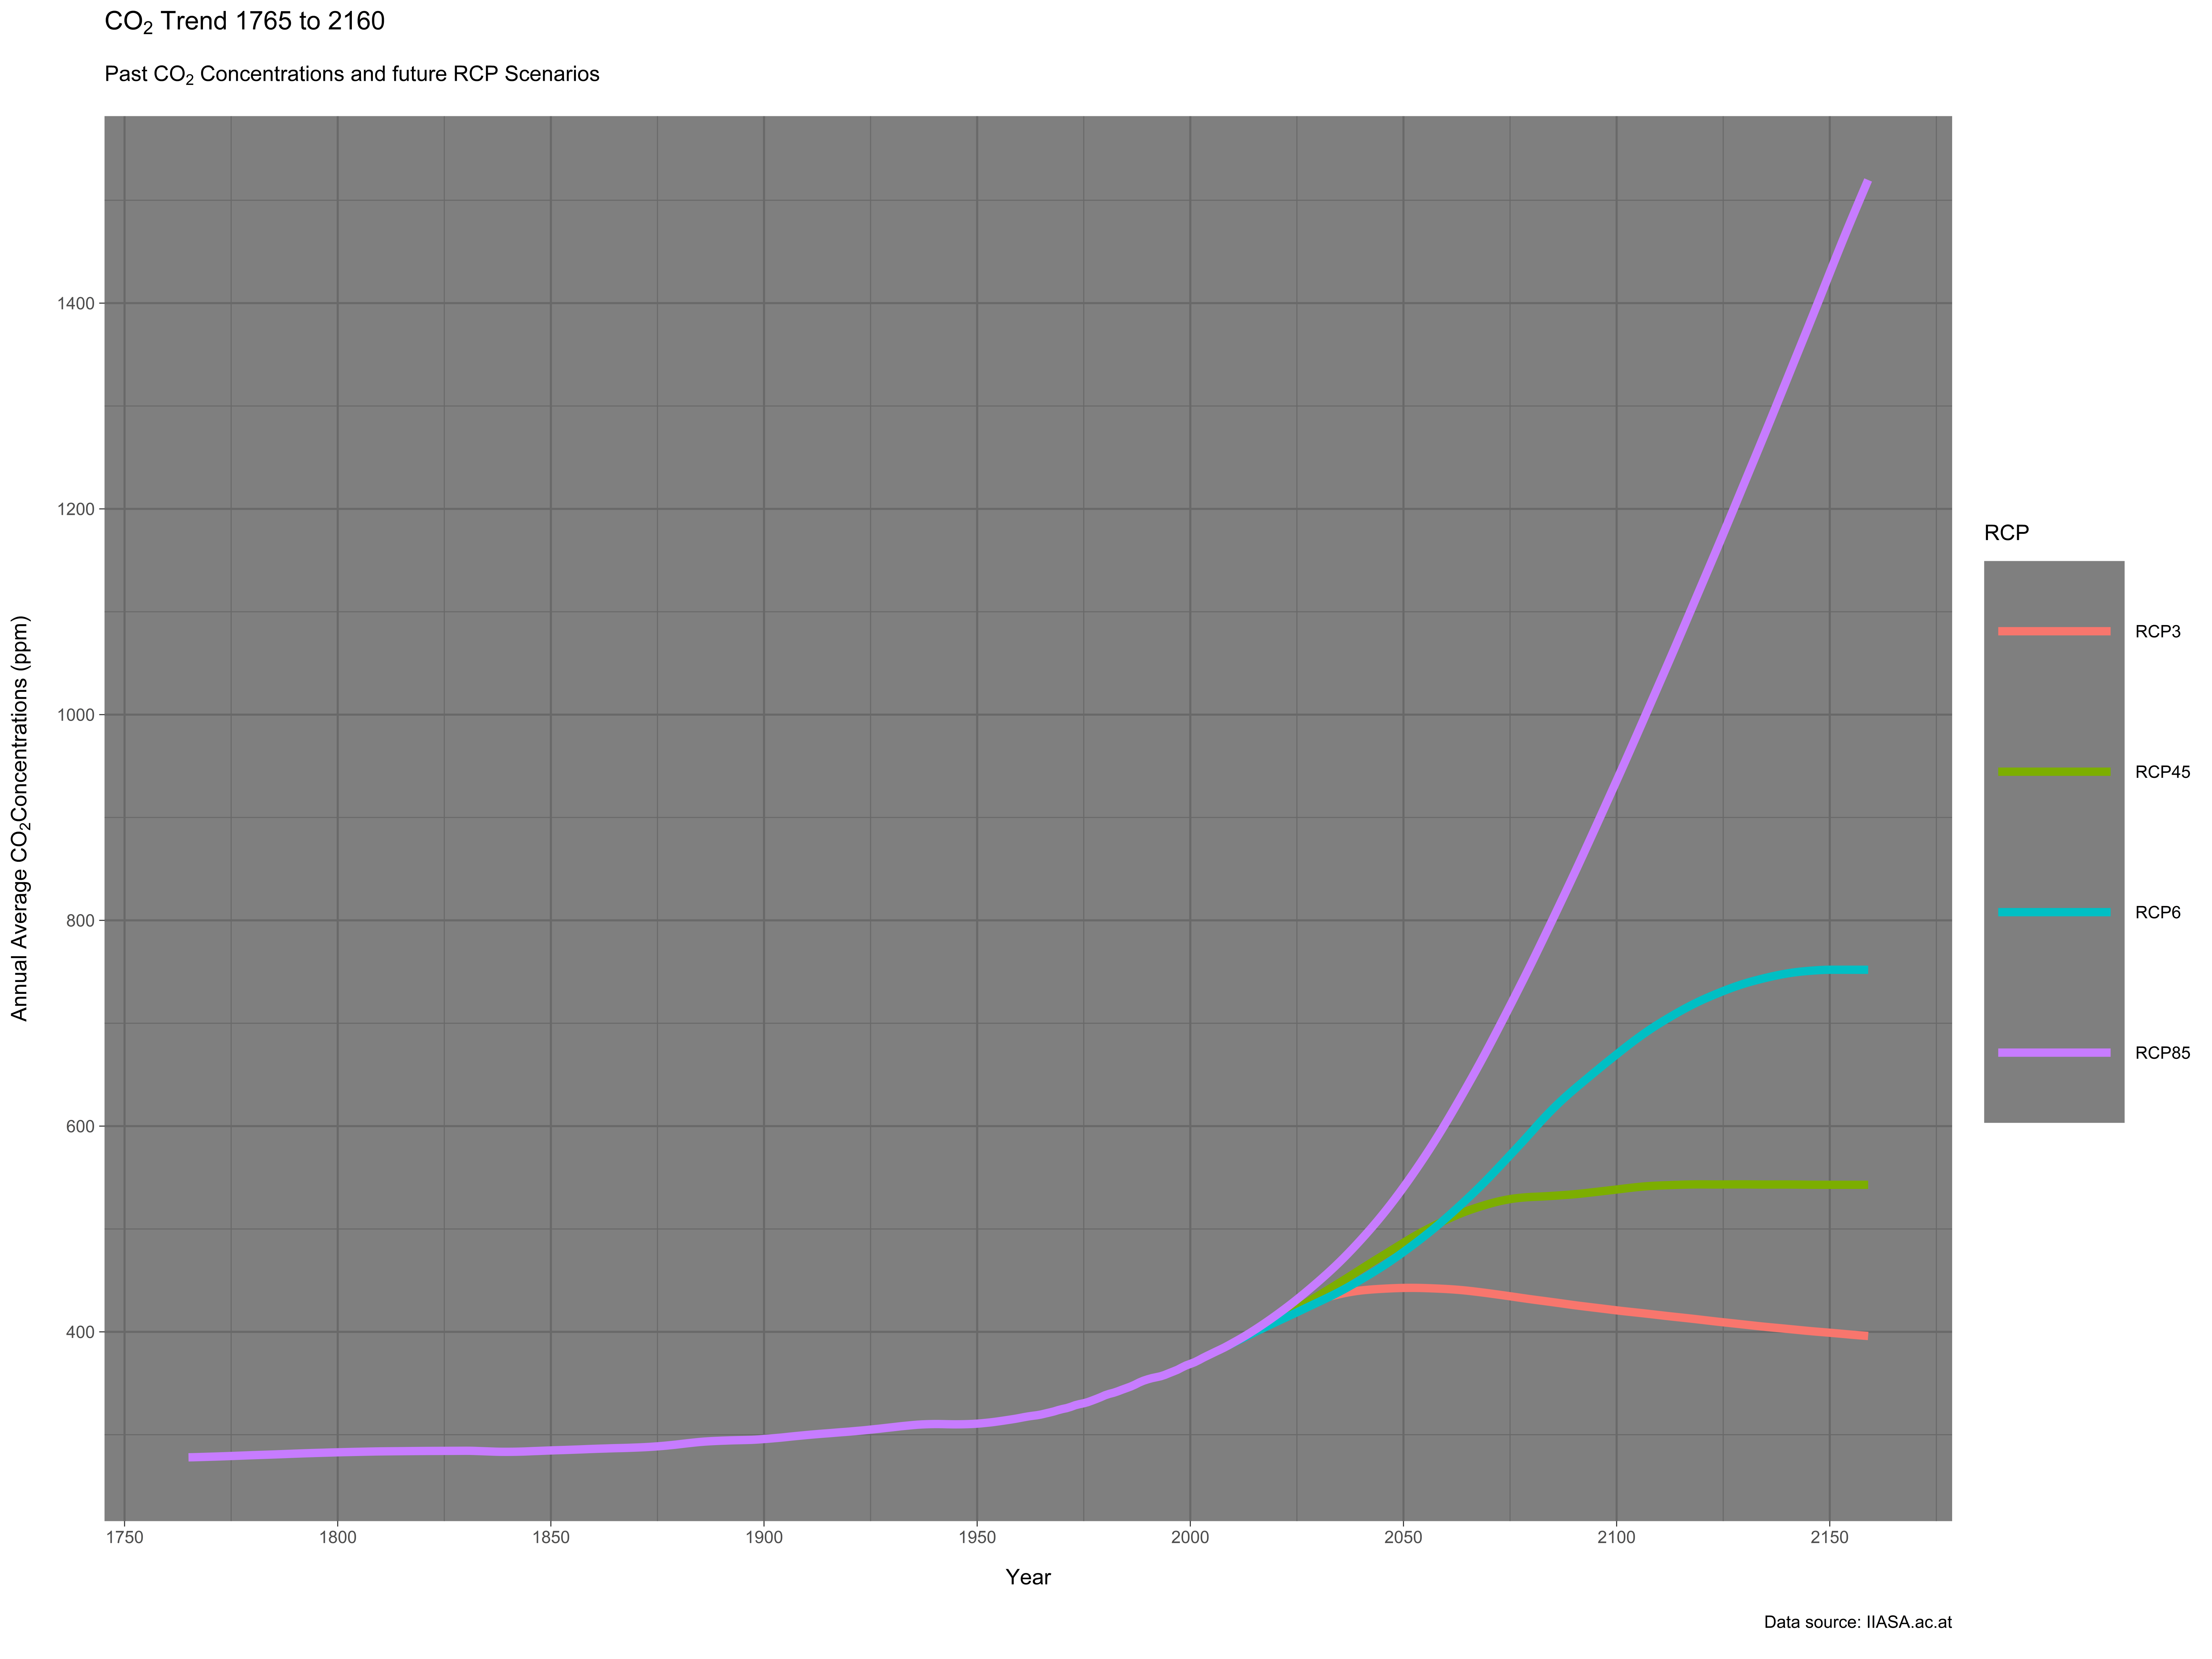
Figure 2: Global average CO2 concentrations for different RCP scenarios.14 |
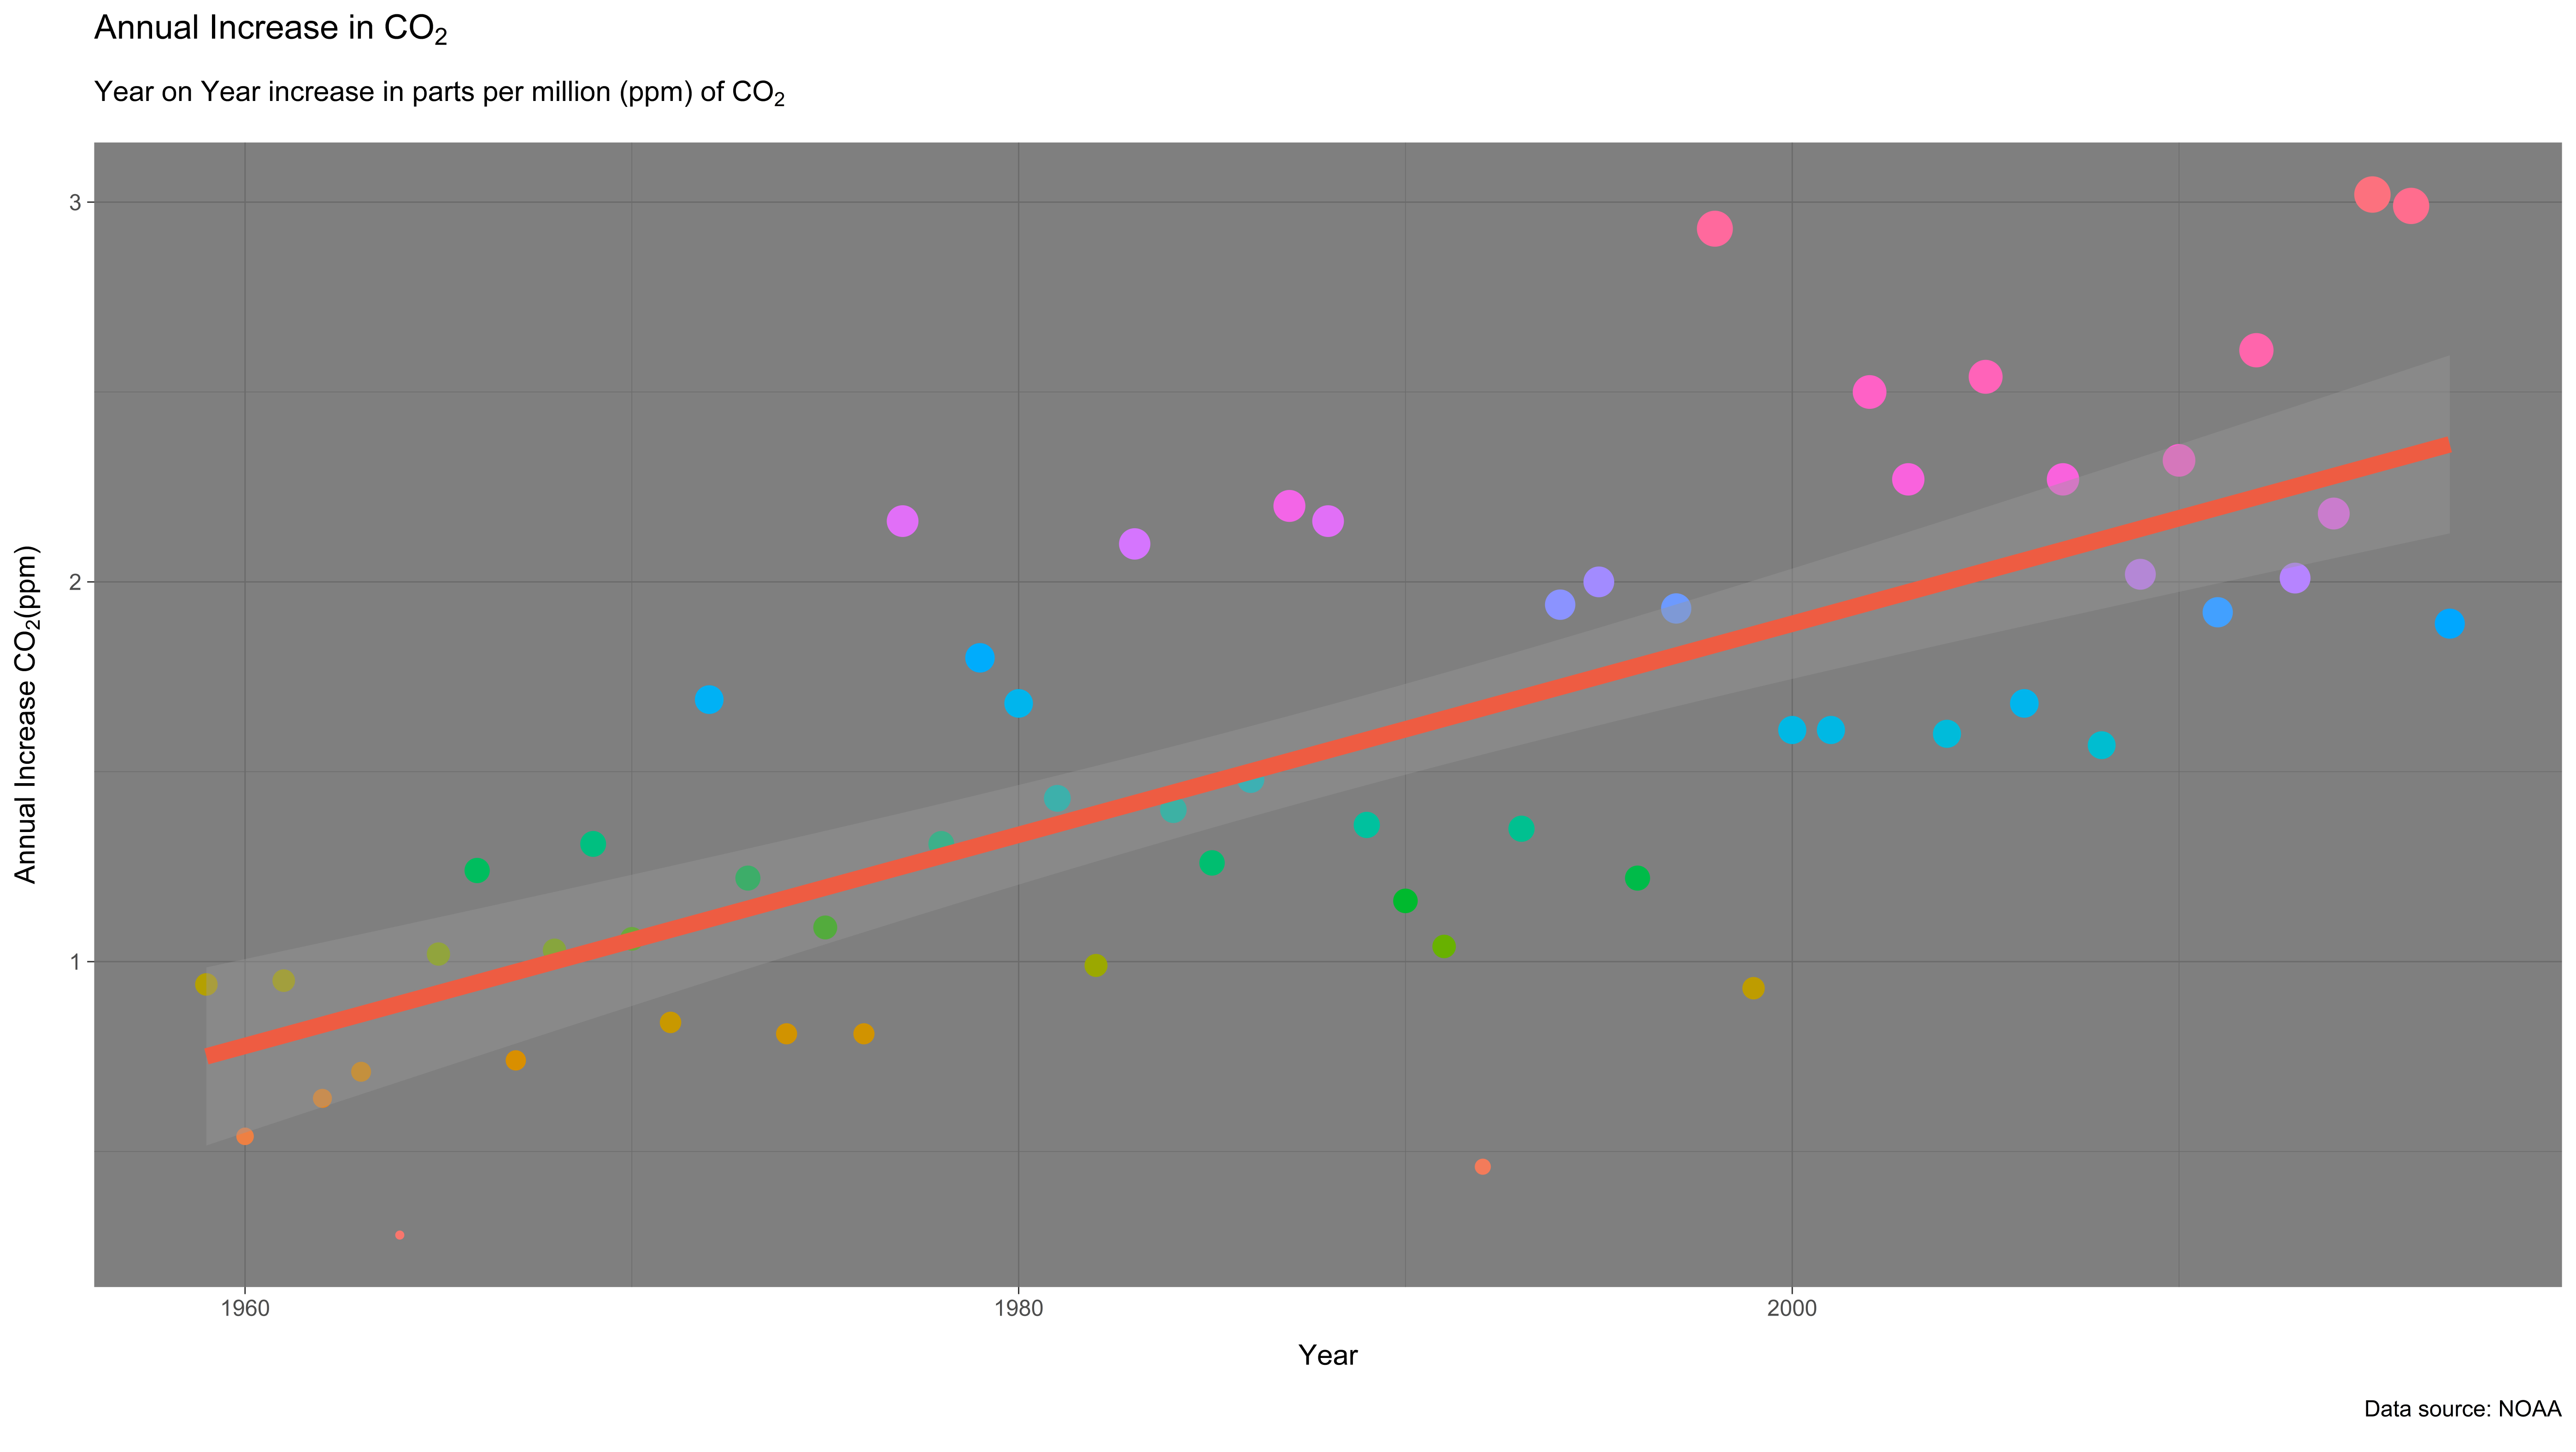
Despite the rhetoric and (non-binding) agreements reached, emissions are accelerating at a frantic pace. In 2018, global CO2 concentrations increased by 2.1 ppm, a marginal slowdown from the 3 ppm rise in 2016 and 2017 (Figure 3). To estimate how these increases will look going forward, the Intergovernmental Panel on Climate Change (IPCC) has developed Representative Concentration Pathways (RCP) based on four main climate scenarios. The two mid-range scenarios, RCP4.5 (4.5 W/m2 radiative forcing by 2100) and RCP6 (6 W/m2), would see 500 ppm reached in the next 40 years. The worst-case scenario presented by the IPCC is RCP8.5 (Radiative forcing of 8.5 W/m2 by 2100) and would see year-on-year CO2 levels rising exponentially and global average concentrations hitting 600 ppm by 2060 and nearly 1000 ppm by the end of the century (Figure 2).
While the IPCC doesn’t explicitly list CO2 as an Air Pollutant, reference is made to “reductions in mental performance at 1,000 ppm”16.
| Figure 3: Year on year increase of CO2 in ppm.14 |
Urban CO2
Sitting in a stuffy room for a few hours might not be nice and hinder our performance, but step outside and your body can begin to recover. However, as outdoor CO2 concentrations rise, the ability of our bodies to do so is being diminished on an almost daily basis.
|
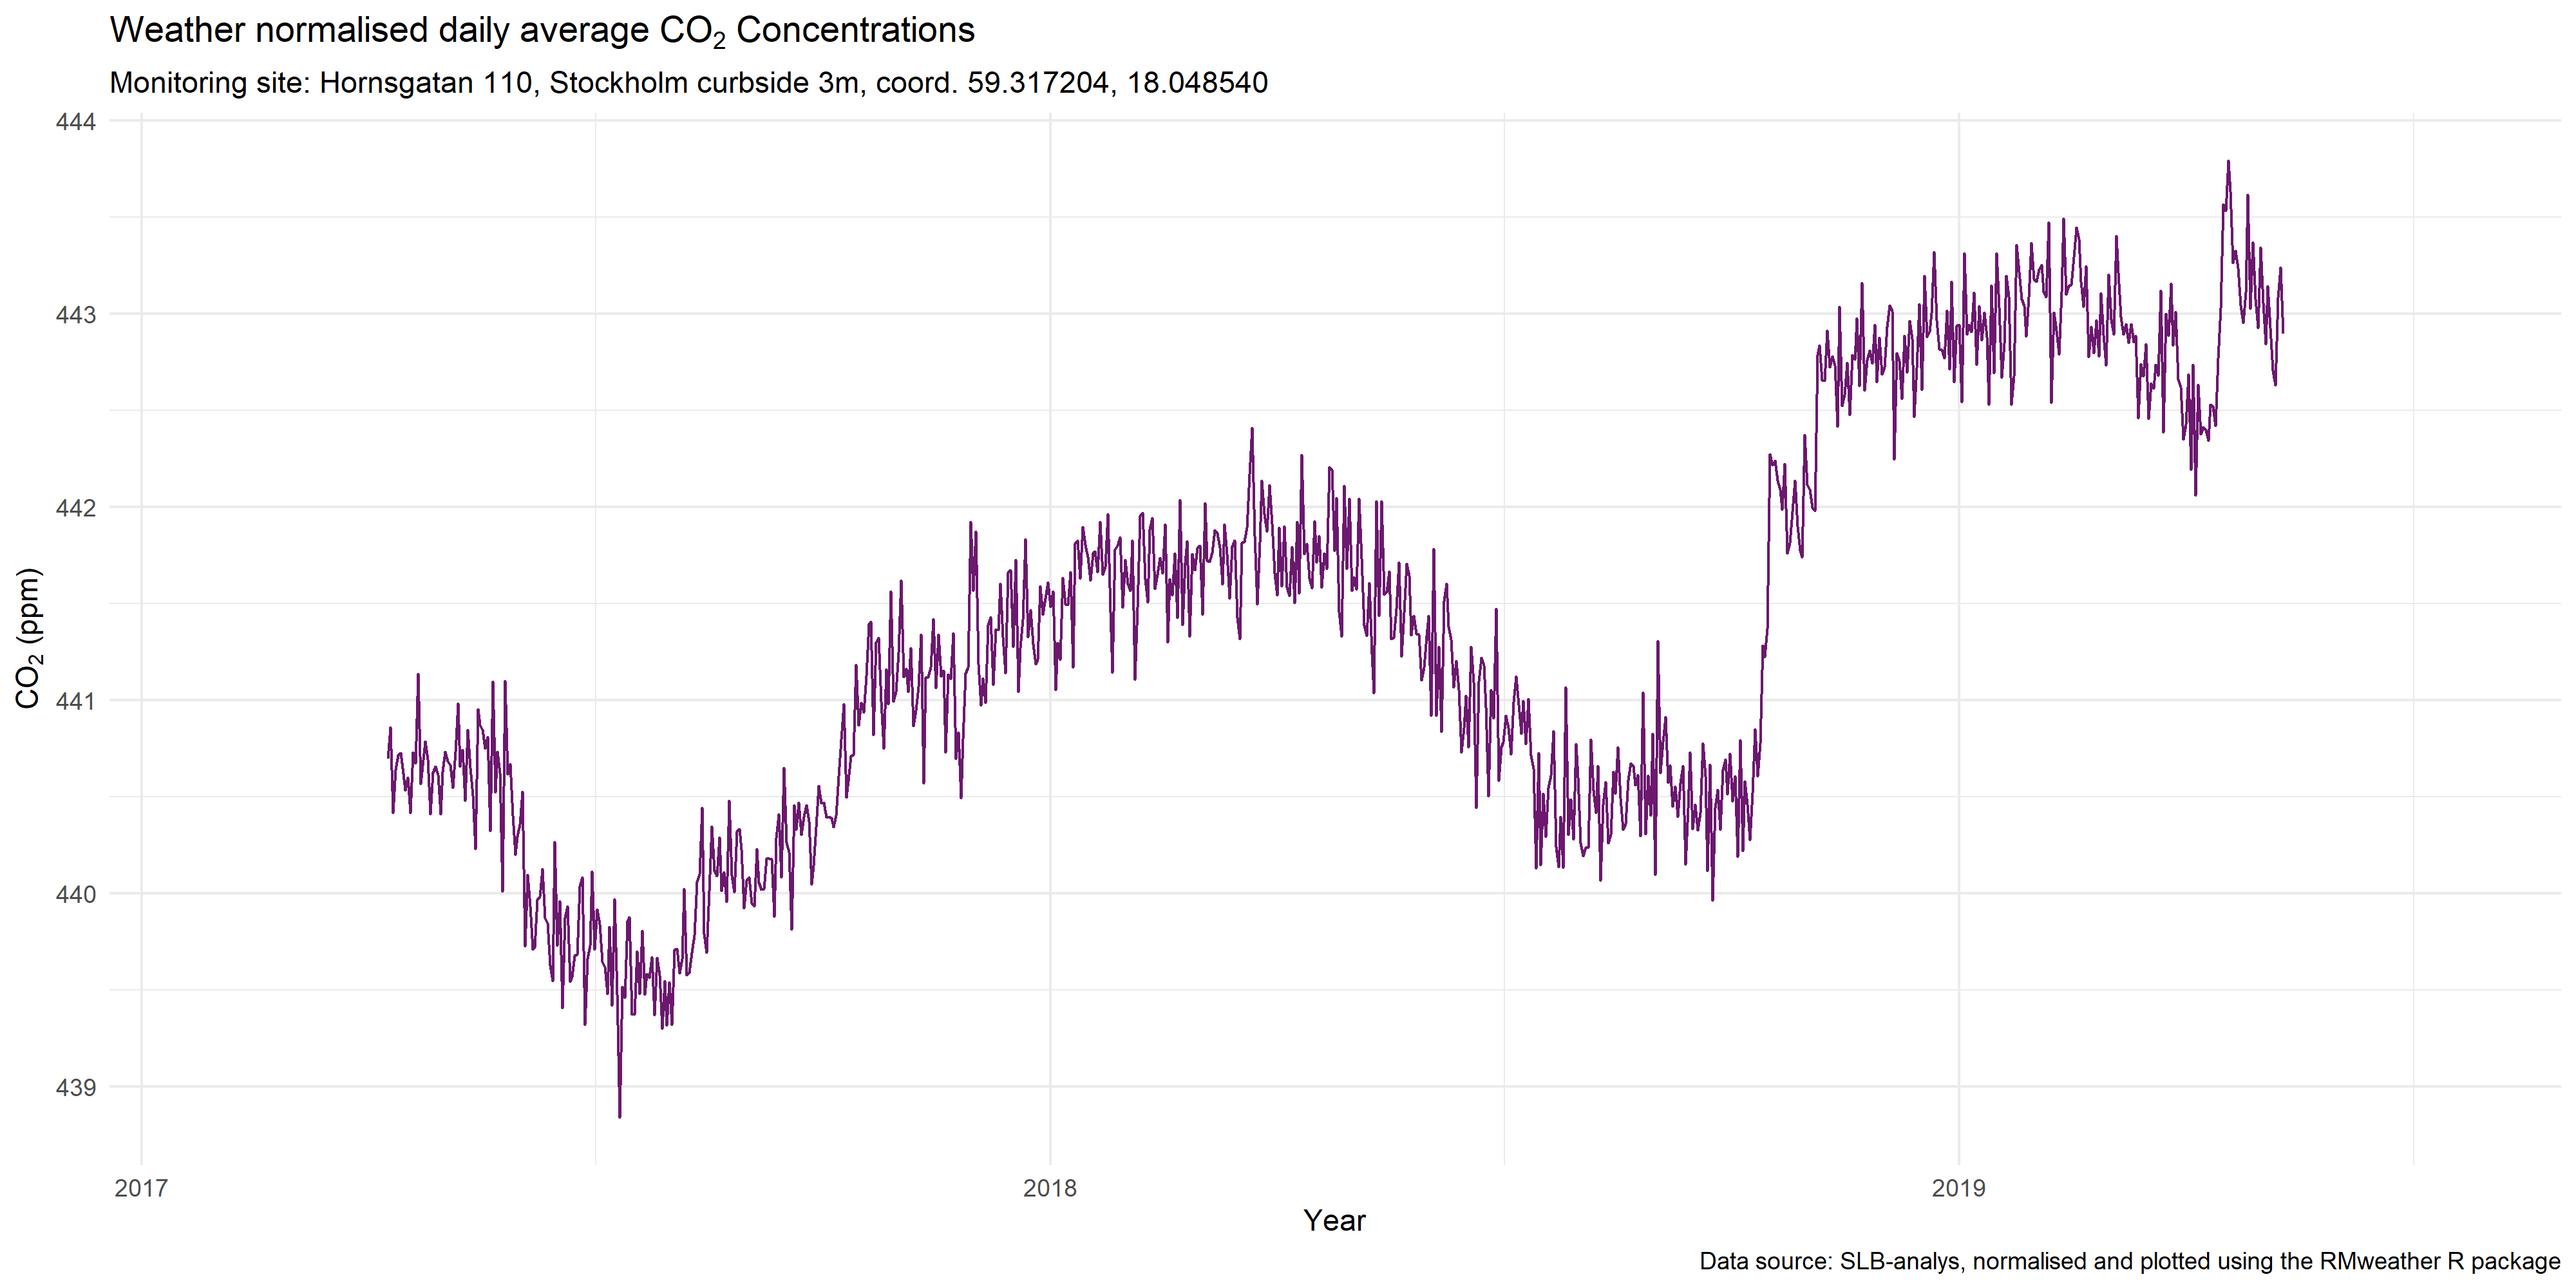
Figure 4: Weather normalised CO2 concentrations along Hornsgaten, Stockholm for the period February 2017 to July 2019 |
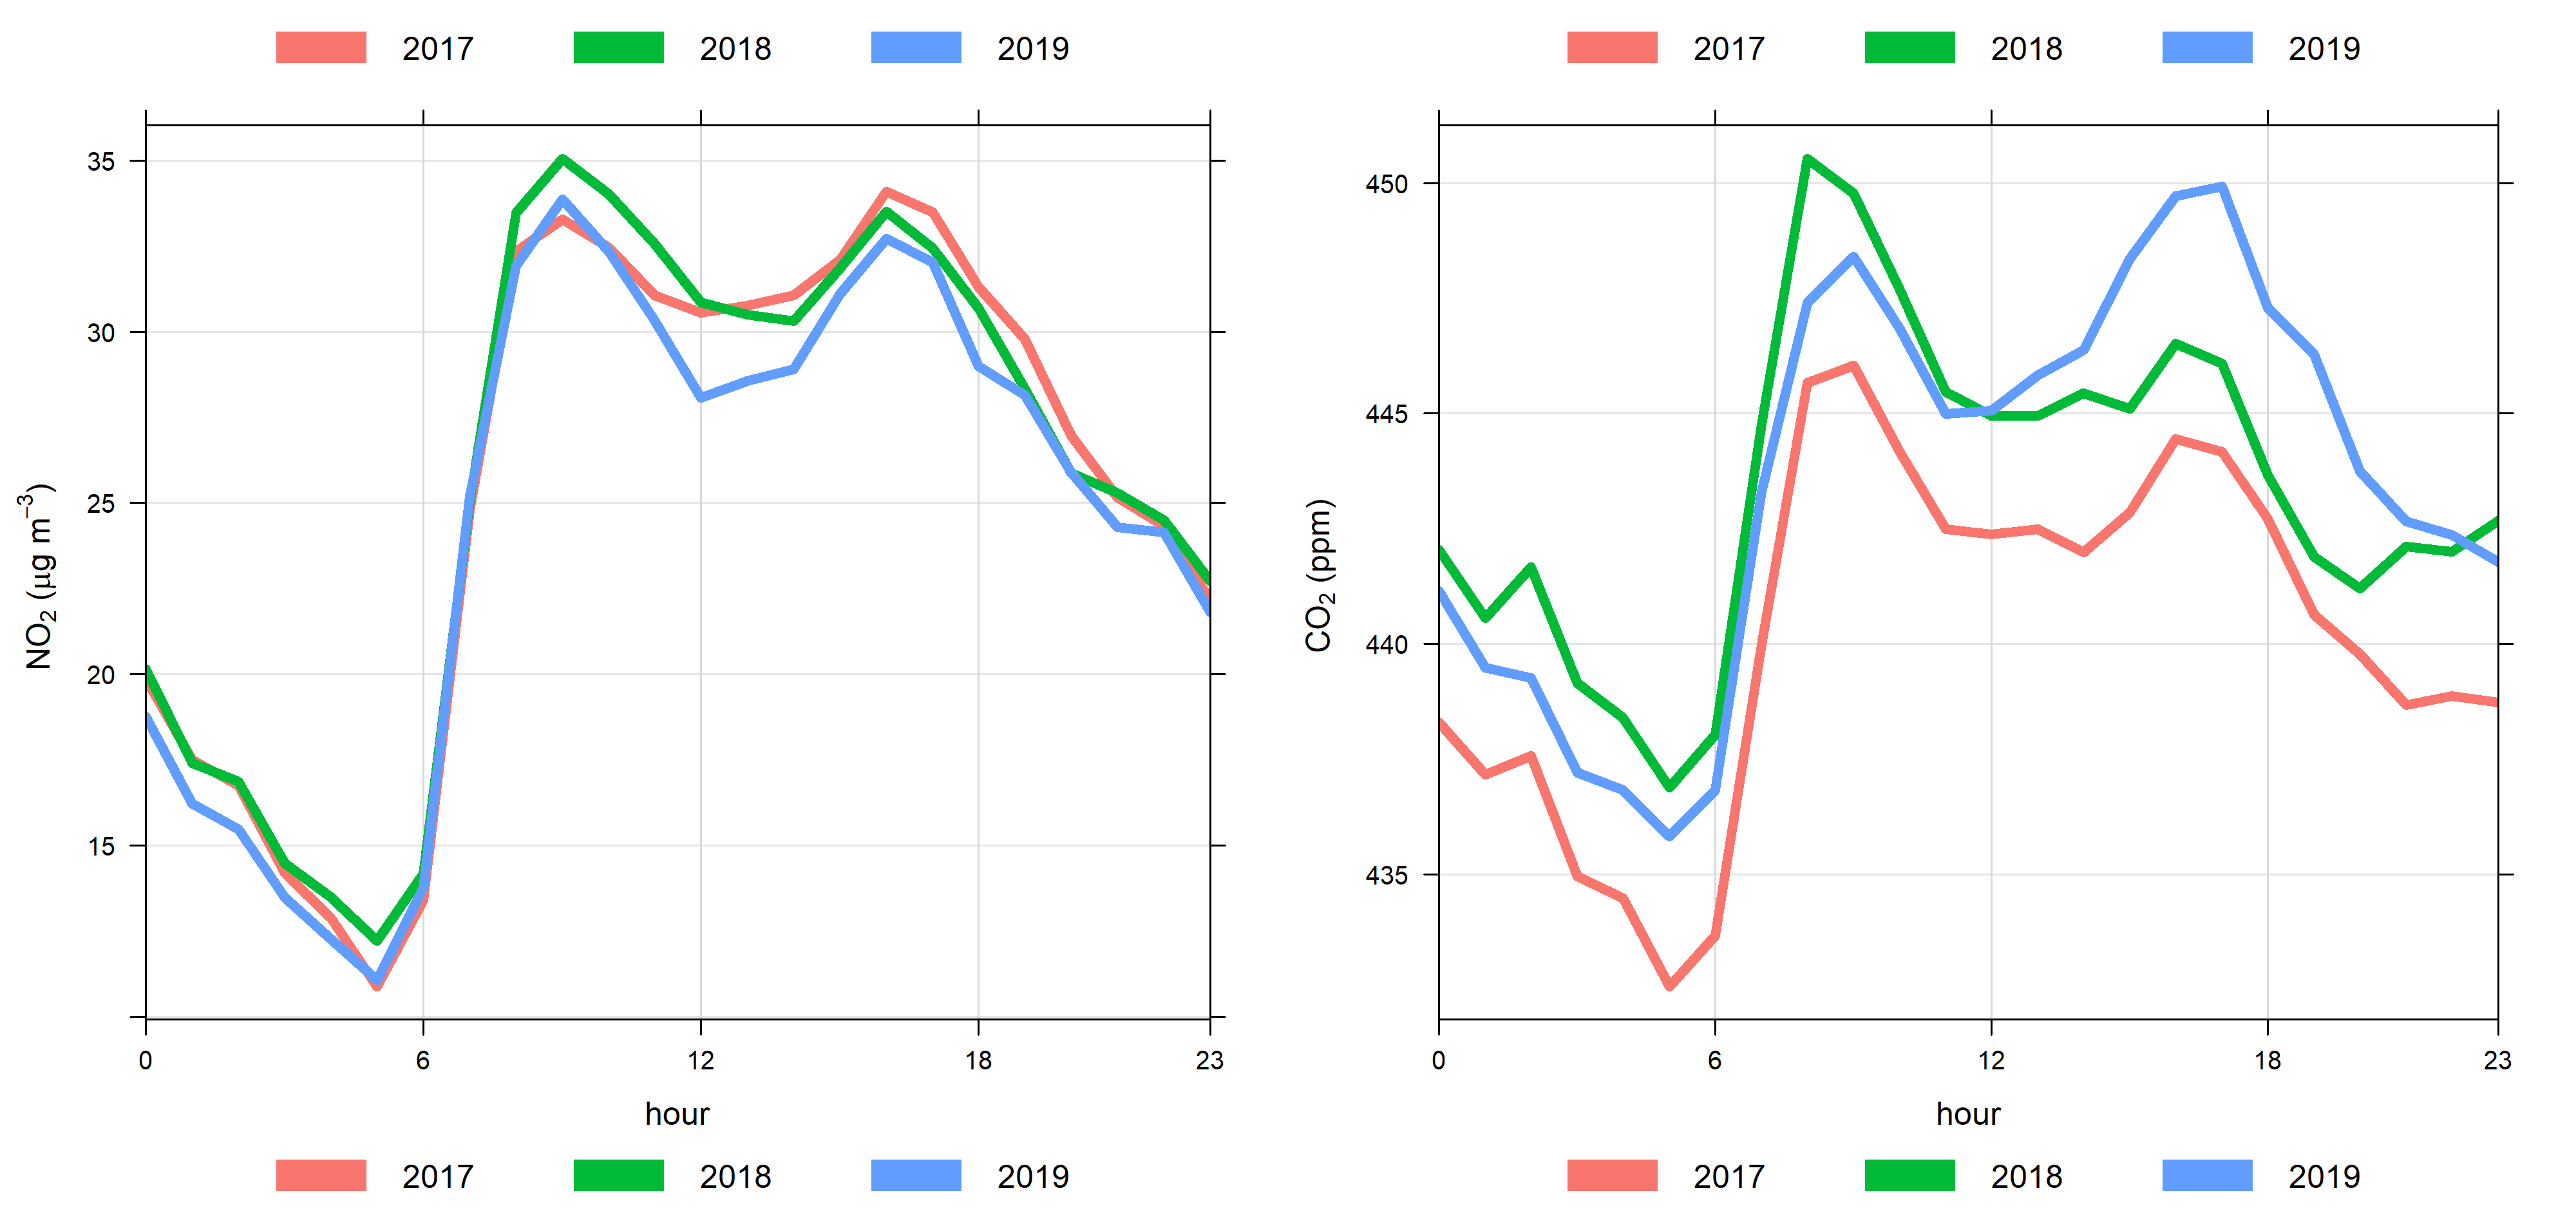
While indoor concentrations are elevated by humans exhaling 45,000 ppm, the urban roadside environment has to contend with vehicle exhausts emitting approximately 140,000 ppm. Kings College London (KCL) has been monitoring roadside CO2 concentrations for the past 10 years. At these sites, it has been reported levels have hit 1,000 ppm17. Other studies of urban areas have shown elevated levels of CO2 concentrations close to roads18. In Stockholm, one of the earliest Low Emission Zone (LEZ) adopters, the busiest and most polluted roads in the city, Hornsgaten, has seen steadily falling roadside Nitrogen Dioxide (NO2) concentrations and now meets the Annual Average EU objective of 40 µg/m3.19 (Figure 4). Yet roadside CO2 concentrations have been steadily increasing and regularly approach 500 ppm. Figure 5 plots the daily average CO2 concentrations from the period of February 2017 to July 2019. Averaging the hourly variation for February to June for all three years shows evening peak roadside concentrations are on average around 7 ppm higher than they were two years ago.
|
Figure 5: Typical hourly average CO2 and NO2 concentrations for the period February to June along Hornsgaten, Stockholm. Plotted using the Openair time Variation function. |
In general, the long term health risks of continually being exposed to chronically elevated CO2 levels are poorly understood. Researching how humans function over extended periods of time at >400 ppm compared with the 250 ppm we lived with for tens of thousands of years is difficult, as nowhere on earth has levels this low any more. It is likely the body has adapted to these small changes relatively unscathed, but as knowledge of the damage other pollutants such as NO2 and Particulate Matter improves, CO2 is adding to the burden we are placing on the body.
With special thanks to Max Elmgren at SLB-analys, for the data on Stockholm City Centre
Blaise Kelly MSc BEng is a Senior Air Quality Consultant in the Hydrock Building Performance Engineering team. He is a member of the Institute of Air Quality Management (MIAQM) and Institution of Environmental Science (MIEnvSc), a Graduate member of CIBSE (GradCIBSE) and the Energy Institute (GradEI).
Want to know more about indoor and outdoor CO2? Why not check out Indoor and outdoor CO2: How does it affect us?
1. 8 January and 2018, “Every Breath You Take: The Process of Breathing Explained,” Nursing Times, accessed July 20, 2019, https://www.nursingtimes.net/clinical-archive/respiratory/every-breath-y....
2. “General Hazards of Carbon Dioxide,” accessed May 4, 2019, http://www.hse.gov.uk/carboncapture/carbondioxide.htm.
3. Allen Joseph G. et al., “Associations of Cognitive Function Scores with Carbon Dioxide, Ventilation, and Volatile Organic Compound Exposures in Office Workers: A Controlled Exposure Study of Green and Conventional Office Environments,” Environmental Health Perspectives 124, no. 6 (June 1, 2016): 805–12, https://doi.org/10.1289/ehp.1510037.
4. Patrick D Cronyn, “Chronic Exposure to Moderately Elevated CO2 during Long-Duration Space Flight” (NASA, March 2012), https://ston.jsc.nasa.gov/collections/trs/_techrep/TP-2012-217358.pdf.
5. Alexsandra Stankovic and David Alexander, “A Review of Cognitive and Behavioral Effects of Increased Carbon Dioxide Exposure in Humans” (NASA, August 2016), https://ston.jsc.nasa.gov/collections/TRS/_techrep/TM-2016-219277.pdf.
6. John T James and Ariel Macatangay, “Carbon Dioxide – Our Common ‘Enemy,’” 2009, 8.https://ntrs.nasa.gov/archive/nasa/casi.ntrs.nasa.gov/20090029352.pdf
7. V Romero, “Kidney Stones: A Global Picture of Prevalence, Incidence, and Associated Risk Factors,” Reviews in Urology, 2010, https://www.ncbi.nlm.nih.gov/pubmed/20811557.
8. Ruby Brillante et al., “An Overnight Increase in CO2 Predicts Mortality in Sleep Disordered Breathing,” Respirology (Carlton, Vic.) 17, no. 6 (August 2012): 933–39, https://doi.org/10.1111/j.1440-1843.2012.02209.x.
9. P. A. Brühwiler et al., “CO2 and O2 Concentrations in Integral Motorcycle Helmets,” Applied Ergonomics 36, no. 5 (September 2005): 2, https://doi.org/10.1016/j.apergo.2005.01.018.
10. Tim Dwyer, “Module 69: Delivering Ventilation to Occupied Spaces,” CIBSE Journal (blog), October 2014, https://www.cibsejournal.com/cpd/modules/2014-10/.
11. Moon Keun Kim, “Ventilation Impact of Outdoor CO2 Concentration Increase,” 2016, 2 https://www.isiaq.org/docs/Papers/Paper112.pdf
12. “CIBSE - Weather Data,” accessed May 5, 2019, https://www.cibse.org/weatherdata.
13. “Monthly Average Mauna Loa CO2,” NOAA, 5th August, 2019, https://www.esrl.noaa.gov/gmd/ccgg/trends/
14. Annmarie Eldering et al., “The Orbiting Carbon Observatory-2: First 18 Months of Science Data Products,” Atmospheric Measurement Techniques 10 (February 15, 2017): 549–63, https://doi.org/10.5194/amt-10-549-2017.
15. NASA, “Earth Fact Sheet,” accessed May 5, 2019, https://nssdc.gsfc.nasa.gov/planetary/factsheet/earthfact.html.
16. KR Smith and A Woodward, “Human Health: Impacts, Adaptation, and Co-Benefits — IPCC,” 2014, https://www.ipcc.ch/report/ar5/wg2/human-health-impacts-adaptation-and-c....
17. Gary Fuller, “CO2 Variations from Plants Overwhelmed by Traffic Emissions | Environment | The Guardian,” April 11, 2019, https://www.theguardian.com/environment/2019/apr/11/co2-variations-from-....
18. H Kim, I Lee, and E Jeon, “Assessment of Urban Area CO2 Concentrations Using the Atmospheric Dispersion Model for Micro Areas,” 2016, 5. http://jacsdirectory.com/journal-of-environmental-sciences-and-pollution...
19. SLB analys and Stockholms stad, “Luften i Stockholm Arsrapport,” May 6, 2019, http://slb.nu/slb/rapporter/pdf8/slb2019_017.pdf.